New York City MTA Subway Traffic
For our first project at Metis Data Science Bootcamp, we used MTA subway traffic data to analyze ridership volumes across stations in the subway system.
The Situation
A fictitious company (WTWY Inc. - Women Tech Women Yes) was hosting a gala early in the Summer and needed assistance to determine part of its advertising strategy. WTWY’s mission statement was to increase the participation of Women in the Tech industry and STEM subjects.
WTWY wanted to advertise the event targeting wealthy individuals and, at the same time, wanted to increase awareness of itself among people who were enthusiastic and passionate about its mission. To this end, WTWY wanted to optimize the location of their canvassing team across the subway stations during its marketing campaign.
Our deadline to analyze the data and make a recommendation was a few days away, and after a conversation with WTWY we determined the following information which helped guide our analysis:
- The gala was to occur the first week of June.
- The canvassing team was comprised of three groups.
- Canvassing groups were mobile and could change locations during the day.
- Canvassing would occur for one week in the spring.
- WTWY’s marketing team determined the target demographic to be individuals already in Tech and in particular: Women already in Tech.
Our Solution
Since canvassing would occur during one week in the spring, we analyzed data for the months of March, April, and May 2017.
Our initial thought was to determine traffic volume for the following target audiences: women in tech on their way to work, individuals in tech during work hours, and women in tech returning home from work.
Given our target audience, it initially seemed best to concentrate on the subway stations in locations where wealthy individuals working in Tech live, and where there is a high density of Tech companies and learning Institutions.
We thought to use census gender and income information in the NYC area to determine those zip codes with a higher proportion of wealthy women but decided against using this data because this information would not tell us if these individuals or women worked in Tech.
At last, we decided to concentrate on subway stations in areas of high density of Tech companies and learning Institutions, presuming that, for WTWY fundraising purposes, people in Tech already fell within the wealthy category.
 |
To capture tech individuals on their way to work, we would analyze turnstile exit counts from subway stations in tech-heavy areas, assuming that people exiting these stations in the morning were working nearby. Similarly, we would examine turnstile entry counts in the evening thinking that people entering these stations worked nearby and were coming out of work. During work hours we would analyze turnstile entry and exit counts information.
Our Results
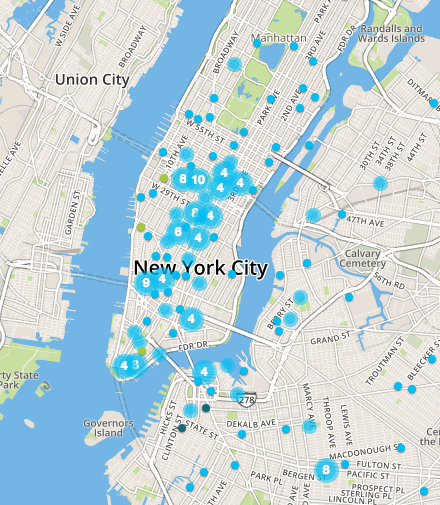
We determined there were five locations that consistently appeared as the best three during each period of the day.
The table below summarizes the best locations to place the canvassing teams during each time of day for each day of the week.
| DAY | MORNING | MIDDLE OF DAY | EVENING |
|---|---|---|---|
| MONDAY | YORK ST - F | YORK ST - F | YORK ST - F |
| 125 ST - 23 | 125 ST - 23 | 125 ST - 23 | |
| 125 ST - 1 | HOYT-SCHER - ACG | HOYT-SCHER - ACG | |
| TUESDAY | YORK ST - F | YORK ST - F | YORK ST - F |
| 125 ST - 23 | 125 ST - 23 | CANAL ST - JNQRZ6W | |
| 125 ST - 1 | HOYT-SCHER - ACG | HOYT-SCHER - ACG | |
| WEDNESDAY | YORK ST - F | YORK ST - F | YORK ST - F |
| 125 ST - 23 | 125 ST - 23 | CANAL ST - 1 | |
| 125 ST - 1 | HOYT-SCHER - ACG | HOYT-SCHER - ACG | |
| THURSDAY | YORK ST - F | YORK ST - F | YORK ST - F |
| 125 ST - 1 | HOYT-SCHER - ACG | HOYT-SCHER - ACG | |
| 125 ST - 23 | 125 ST - 23 | CANAL ST - 1 | |
| FRIDAY | YORK ST - F | YORK ST - F | YORK ST - F |
| 125 ST - 23 | 125 ST - 23 | CANAL ST - 1 | |
| 125 ST - 1 | HOYT-SCHER - ACG | HOYT-SCHER - ACG |